SpotCam Sense and SpotCam Sense Pro, unlike other home monitoring camera, equipped with multiple sensors in the camera to detect humidity, temperature, illumination status and provide home vital information in your place along with live video streaming.
View home vitals on your mobile device
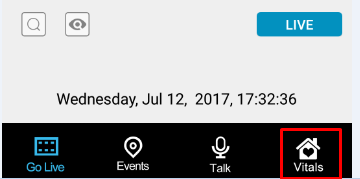
To view home vitals simply click “Vitals” button as shown below on your mobile phone or tablet:
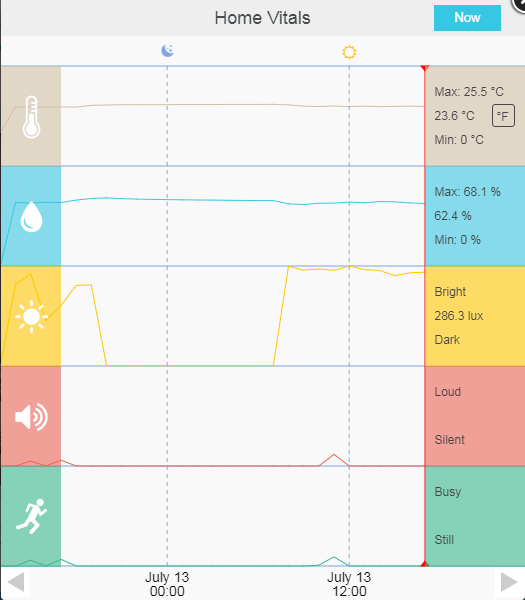
After click “Vitals” button, you will see below Home Vitals page with vital information displayed in line chart with timeline. All vital information will be stored for 7 days and can be viewed by scrolling timeline.
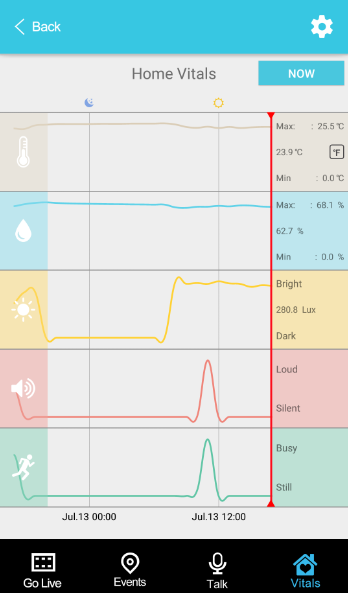
Humidity, temperature, and illumination values are calculated on an hourly average basis. For activity and sound, SpotCam cloud server calculate the activity and sound level of your SpotCam and display the result in line chat, the higher the line means louder or busier in your place and the lower means more silent or still.
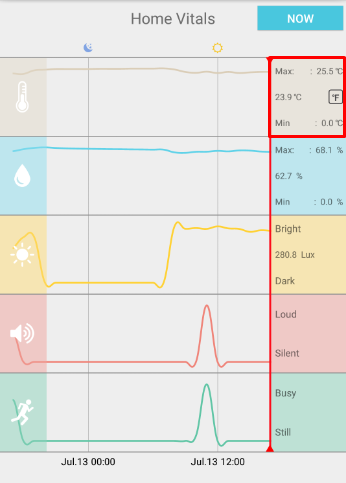
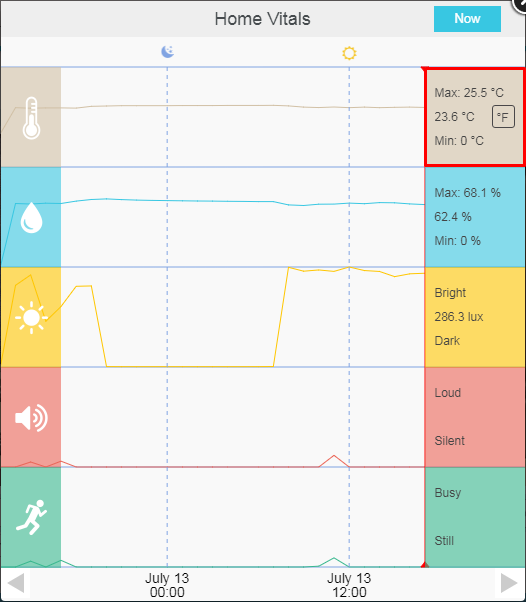
Red vertical line indicates the time point in focus and vital information of that time point can be seen on the right-hand side column. “Max” readings is the maximum value in last 7 days and “Min” readings is the lowest value in last 7 days, while the middle value tells the value at the time point indicates by red vertical line.
 View home vitals on web page
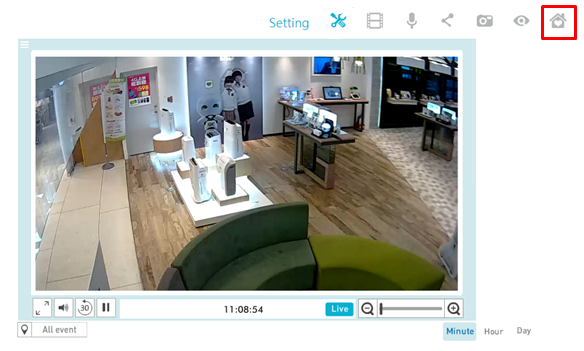
To view home vitals on webpage, please first log in MySpotCam.com using your SpotCam account, then go to your SpotCam live video page, and then on top right corner click “Vitals” button as shown below.
After click the button, you will see below Home Vitals floating window showing you humidity, temperature, illumination, sound, and activity in line chart with timeline. All vital information will be stored for 7 days and can be viewed by scrolling timeline.
Same as mobile app interface, humidity, temperature, and illumination values are calculated on an hourly average basis. For activity and sound, SpotCam cloud server calculate the activity and sound level of your SpotCam and display the result in line chat, the higher the line means louder or busier in your place and the lower means more silent or still.
Red vertical line indicates the time point in focus and vital information of that time point can be seen on the right-hand side column. “Max” readings is the maximum value in last 7 days and “Min” readings is the lowest value in last 7 days, while the middle value tells the value at the time point indicates by red vertical line.


 English
 English (UK)
 日本語
日本語 繁中 (台灣)
 繁中 (香港)
 Deutsch
 Français